Hamilton Studio
ProjectsWritingSounds

© 2026 daniel hamilton ·raleigh, nc

Back to projectsellsworth.ai ↗

Ellsworth.ai

2026-06

An art history explorer built around data visualization, AI-generated narrative, and the connections between movements, artists, and ideas across 5,000 years.

personal projectproduct designdata visualizationaiart historyd3apimuseums
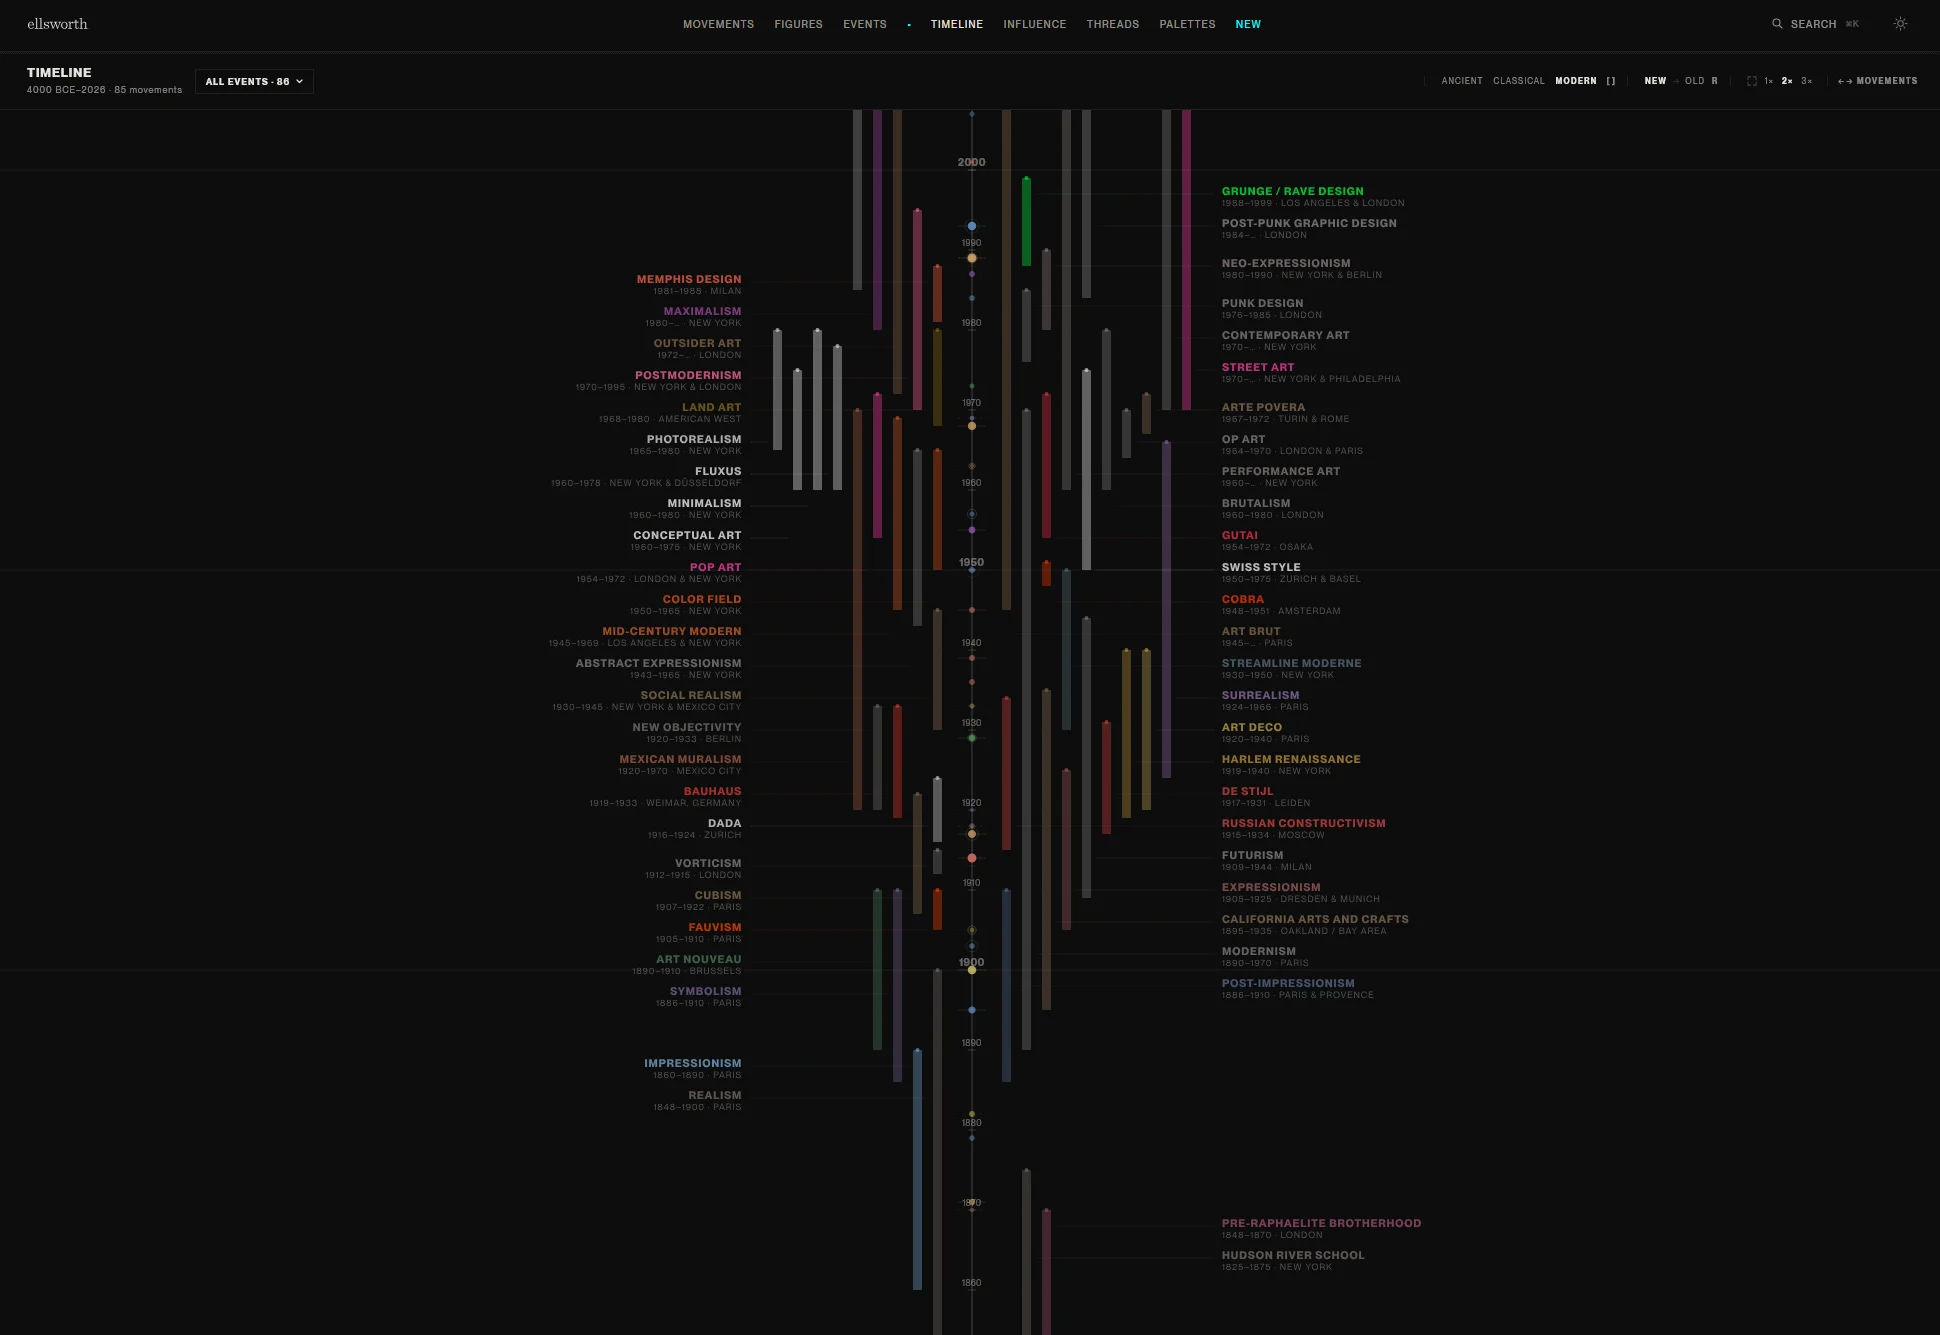
Ellsworth timeline: 85 movements from 4000 BCE to the present as proportional colored bars

Art history suffers from a fragmentation problem that has nothing to do with gaps in scholarship. The knowledge exists. The Metropolitan Museum has published its entire collection through an open API. The Rijksmuseum, the Getty, the Tate, and a dozen other major institutions have done the same. Wikipedia covers every significant movement and figure in remarkable depth. Wikidata structures relationships across all of it. The data is out there. What's missing is a layer that pulls it together and makes the connections navigable.

That's what I wanted to build: not a catalog or a reference site, but something closer to a research environment. A place where you can look at all of Impressionism's characteristic colors as a data visualization, follow an influence edge from Courbet to Manet, and understand what was happening in the world when a movement emerged or collapsed. The relationships are what explain art history. The chronology alone doesn't.

Named after Ellsworth Kelly

The project takes its name from Ellsworth Kelly because his work is a useful design constraint. Dark canvas. Color used to carry meaning, never as decoration. Nothing in the frame that doesn't do work. That became the design brief: Wikipedia density, FiveThirtyEight rigor, no visual noise.

The interface runs on a dark background with movement accent colors used sparingly, always pulled from real palette data rather than chosen aesthetically. Typography is neutral and hierarchical. The data is the thing.

The data layer

Ellsworth aggregates from thirteen museum collections and two major knowledge APIs. The museum sources are the Metropolitan Museum of Art, the Art Institute of Chicago, the Rijksmuseum, the J. Paul Getty Museum, the Tate, the National Gallery of Art, the Cleveland Museum of Art, the Library of Congress, the Smithsonian Institution, the Harvard Art Museums, the Victoria and Albert Museum, the Museum of Modern Art, and the Princeton University Art Museum. The knowledge layer runs on Wikipedia and Wikidata. Narrative content is generated by Claude.

Every one of these sources has different data structures, different levels of detail, and different conventions for how they describe the same things. A Rijksmuseum record and a MoMA record for a work from the same period might agree on the title and date while differing on movement attribution, nationality encoding, and how they handle medium description. The normalization work is substantial.

The core database is PostgreSQL. Collections data comes in through ingestion jobs that hit each museum API, parse the response into a normalized schema, and write to a staging table before the data gets validated and merged. Duplicate detection runs on a combination of artist name, birth/death year, and work title. Artworks are associated with movements through a junction table that carries a confidence weight, since some attributions are clean and others are ambiguous.

Redis sits in front of all Claude-generated content. Every narrative profile, every movement summary, every style analysis is cached and keyed to a combination of the subject ID and the prompt version. Updating the voice or tone of a profile means bumping the prompt version number, which invalidates only the content generated with the old prompt. You don't have to regenerate everything from scratch every time you want to refine the writing.

Architecture overview

PostgreSQL for the primary data store, Redis for AI-generated content caching keyed to prompt version, Next.js 15 for the frontend, D3 for the network and timeline visualizations. Museum data ingests through per-institution API clients that normalize to a shared schema. Claude handles all editorial content through a versioned prompt system.

The intelligence layer

Claude's role in Ellsworth is editorial, not retrieval. The museum APIs and Wikidata provide the facts: dates, locations, artists, attributions, relationships. Claude turns those facts into prose that explains what a movement was reacting against, what it made possible, how it felt from the inside.

The prompts are carefully structured to avoid the kind of neutral, encyclopedic tone that you'd get from a summary of Wikipedia. Each movement profile includes a brief on the historical context, the key figures and their specific contributions, the movement's internal tensions and factions, and its downstream influence. The output reads more like a good piece of arts journalism than a dictionary entry.

Prompt versioning is how this stays maintainable at scale. Every output is stored with a prompt_version field alongside the content. When I refine the voice, add new instructions, or adjust the structure, I bump the version. Cache lookups check the version before returning cached content, so only changed-prompt content gets regenerated. For a database of this size, that distinction matters.
01

Timeline

proportional · colored · pinned events

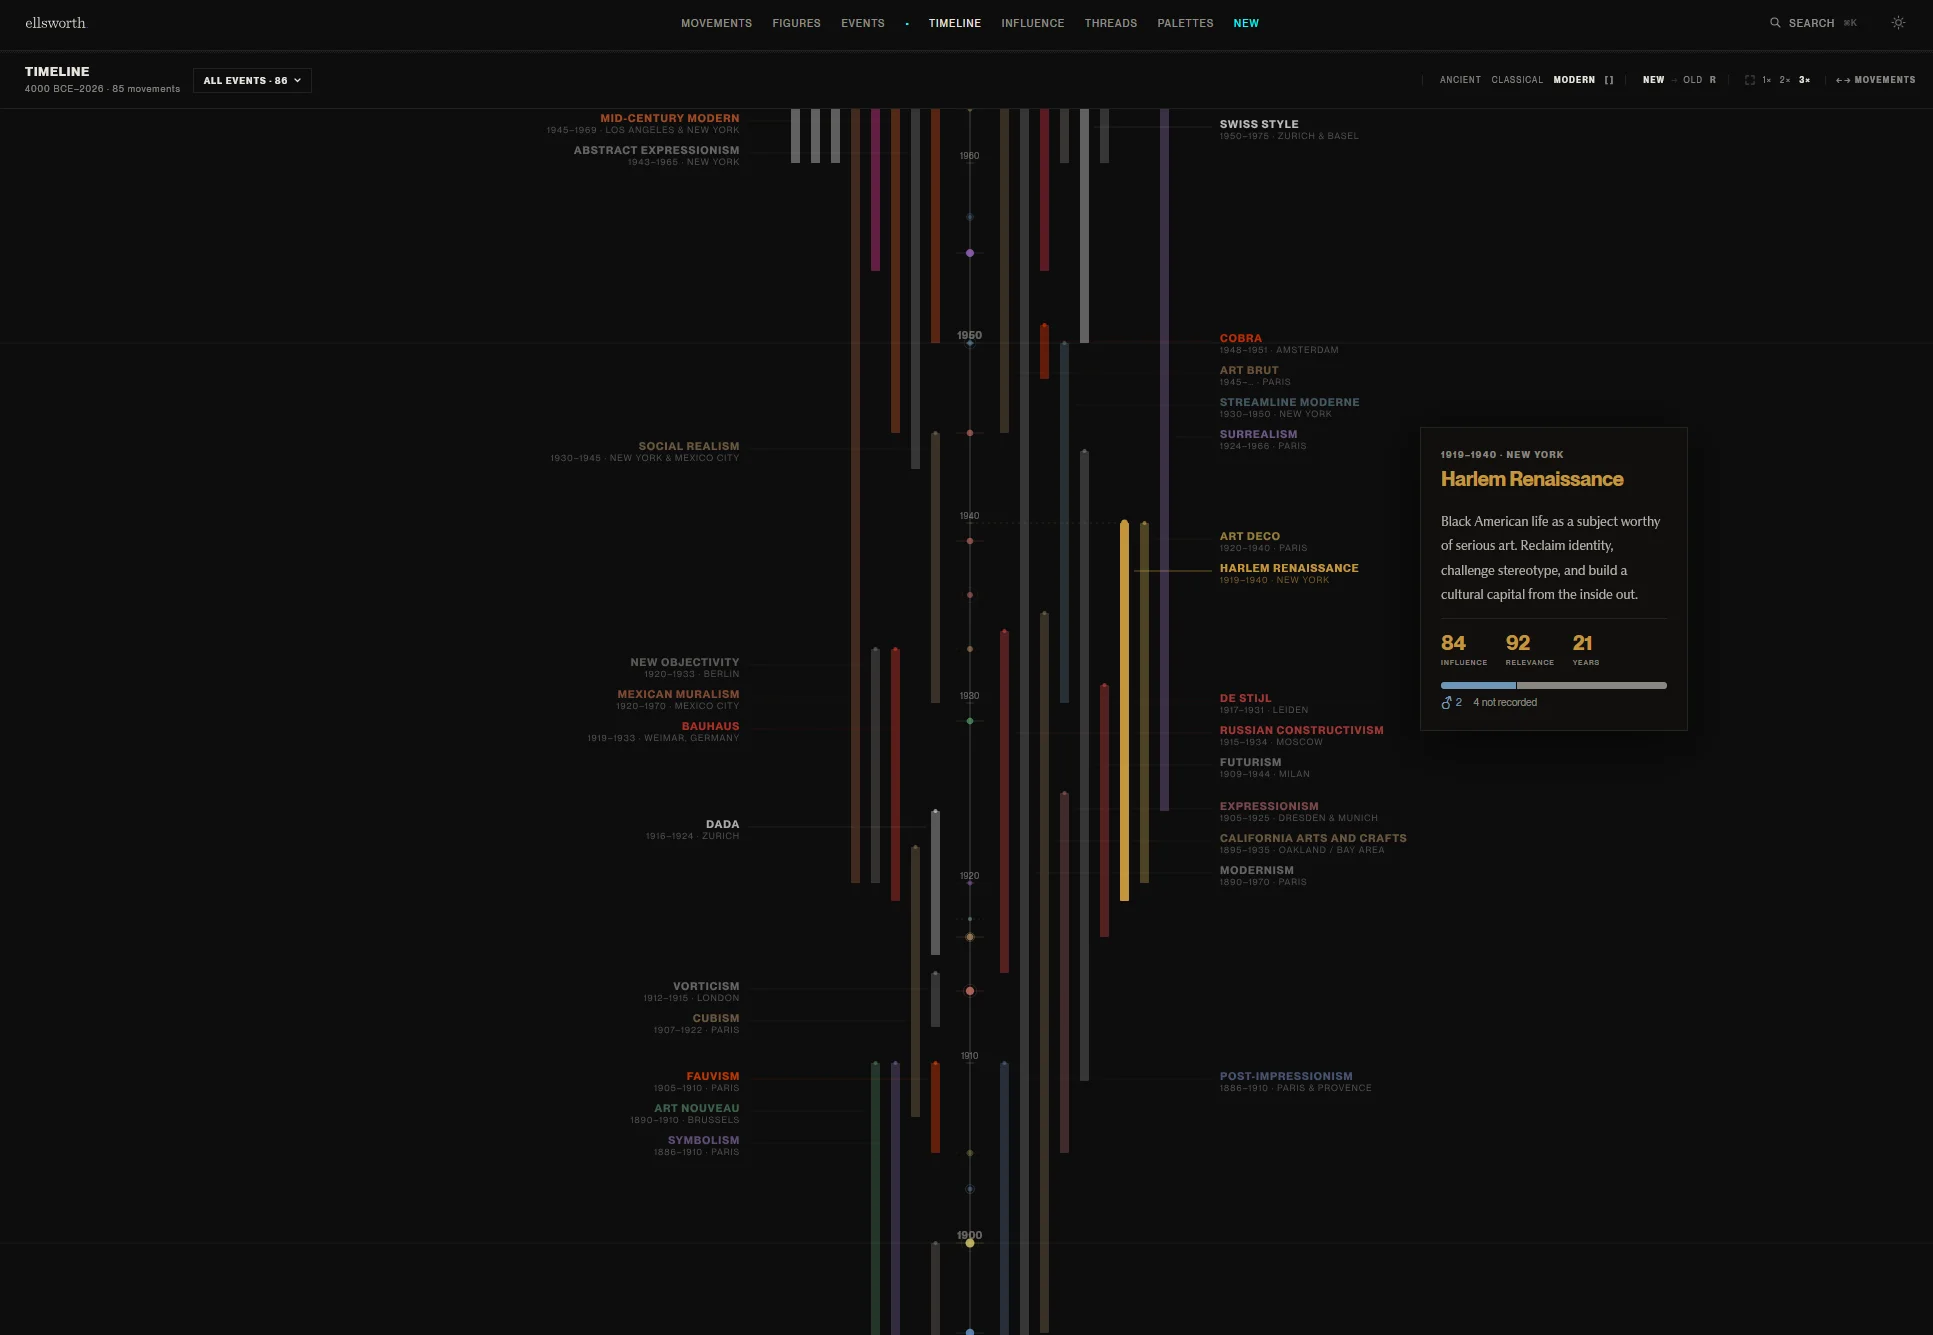
The main interface is a proportional timeline spanning 4,000 BCE to the present. Every movement appears as a vertical bar scaled to its actual historical duration and colored by its characteristic palette, computed from the artwork data rather than assigned by hand. Movements overlap where they actually overlapped. Three zoom levels, three era filters, keyboard shortcuts for jumping between periods.

Timeline overview: every movement as a proportional bar, colored by its characteristic palette

Every movement scaled to its actual historical duration. The density of the late 19th century is visible at a glance.

Timeline at 3x zoom: individual movements readable with date ranges and overlapping contemporaries
3×Individual movements readable with dates, geography, and overlapping contemporaries
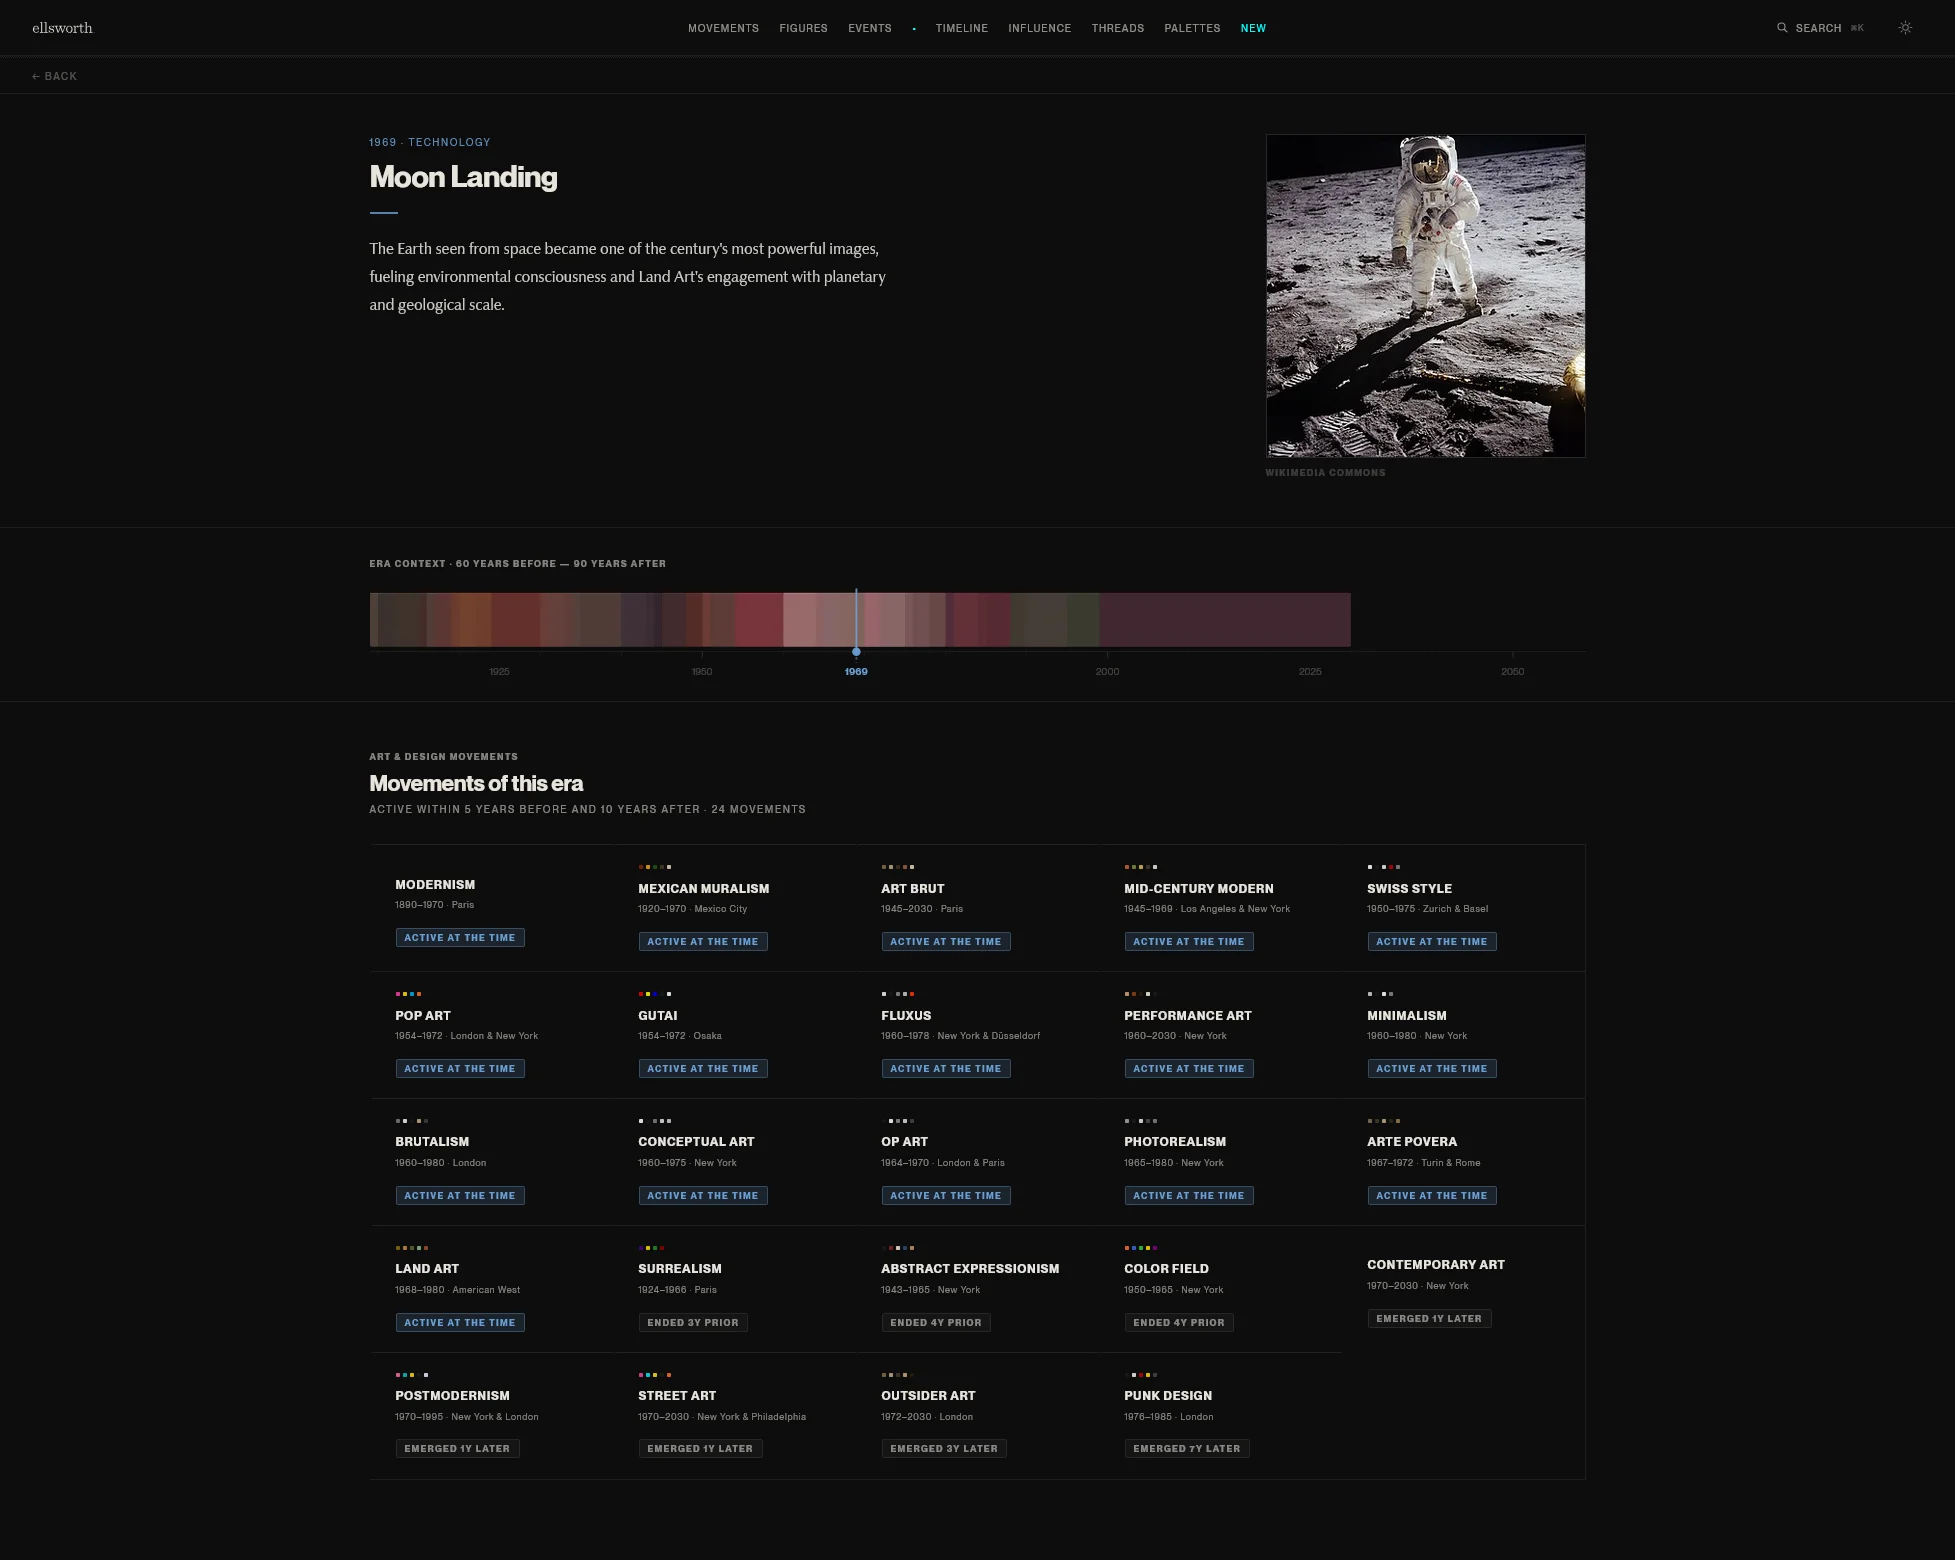
World events pinned to the timeline: the Black Death, French Revolution, World War I mapped to active movements
Events80+ world events from 3100 BCE to 2025, each with an Era Strip showing active movements in the surrounding 150 years
02

Networks

influence · threads

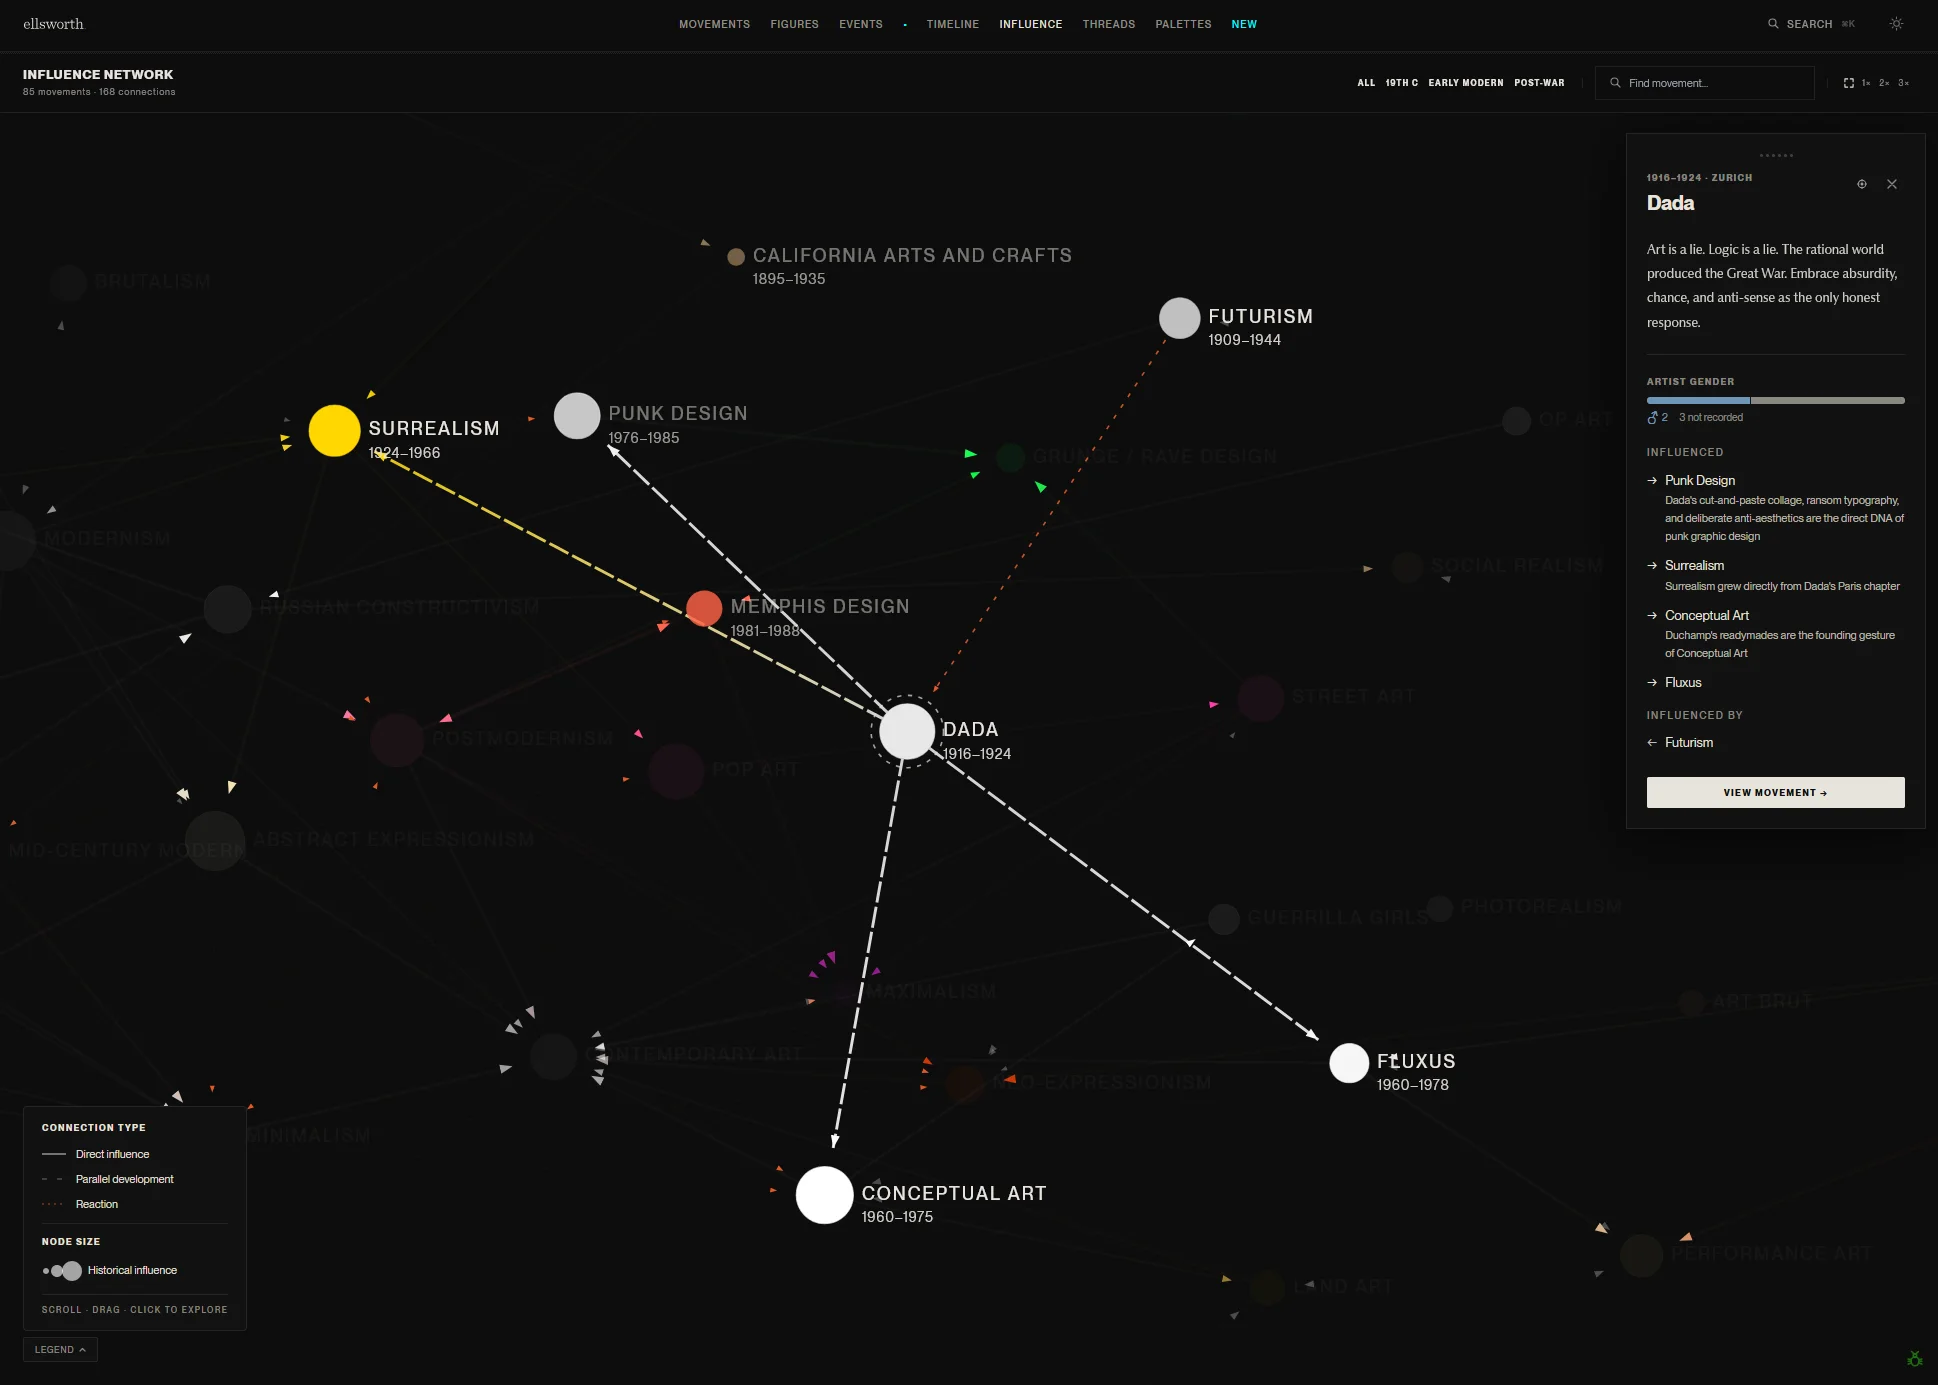
The Influence Network is a force-directed graph where every node is a movement and every edge is a documented influence relationship with a direction and a weight. The graph surfaces what linear presentations miss: parallel movements responding to the same cultural moment from different paths. Those lateral connections tend to be the most revealing.

Influence network: force-directed graph of artistic influence, directed edges weighted by influence score, color-coded by movement
InfluenceForce-directed graph — directed edges weighted by influence score, color-coded by movement, searchable and draggable

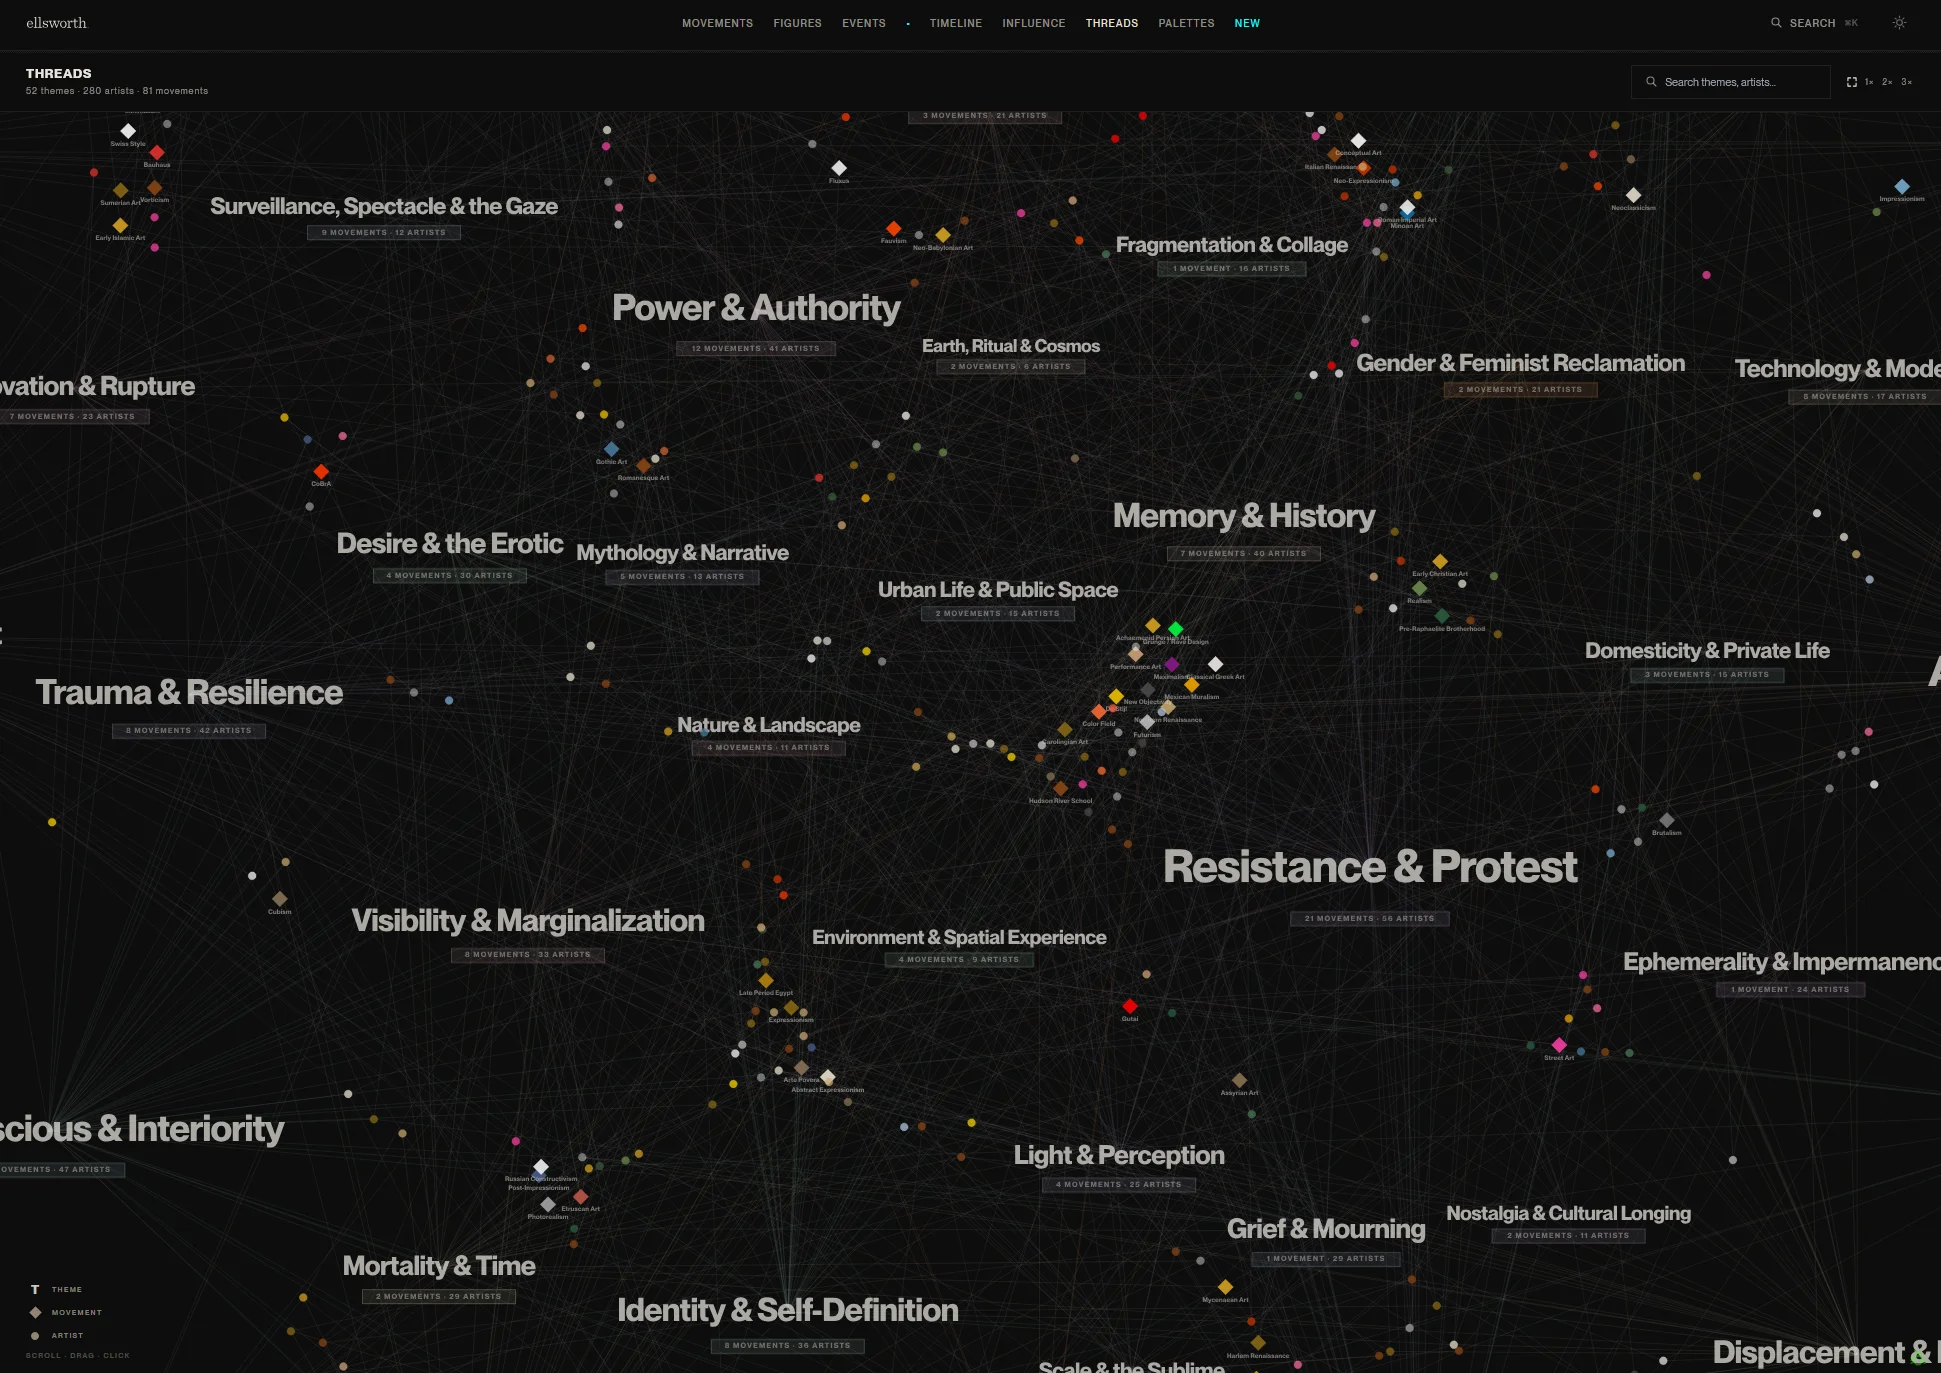
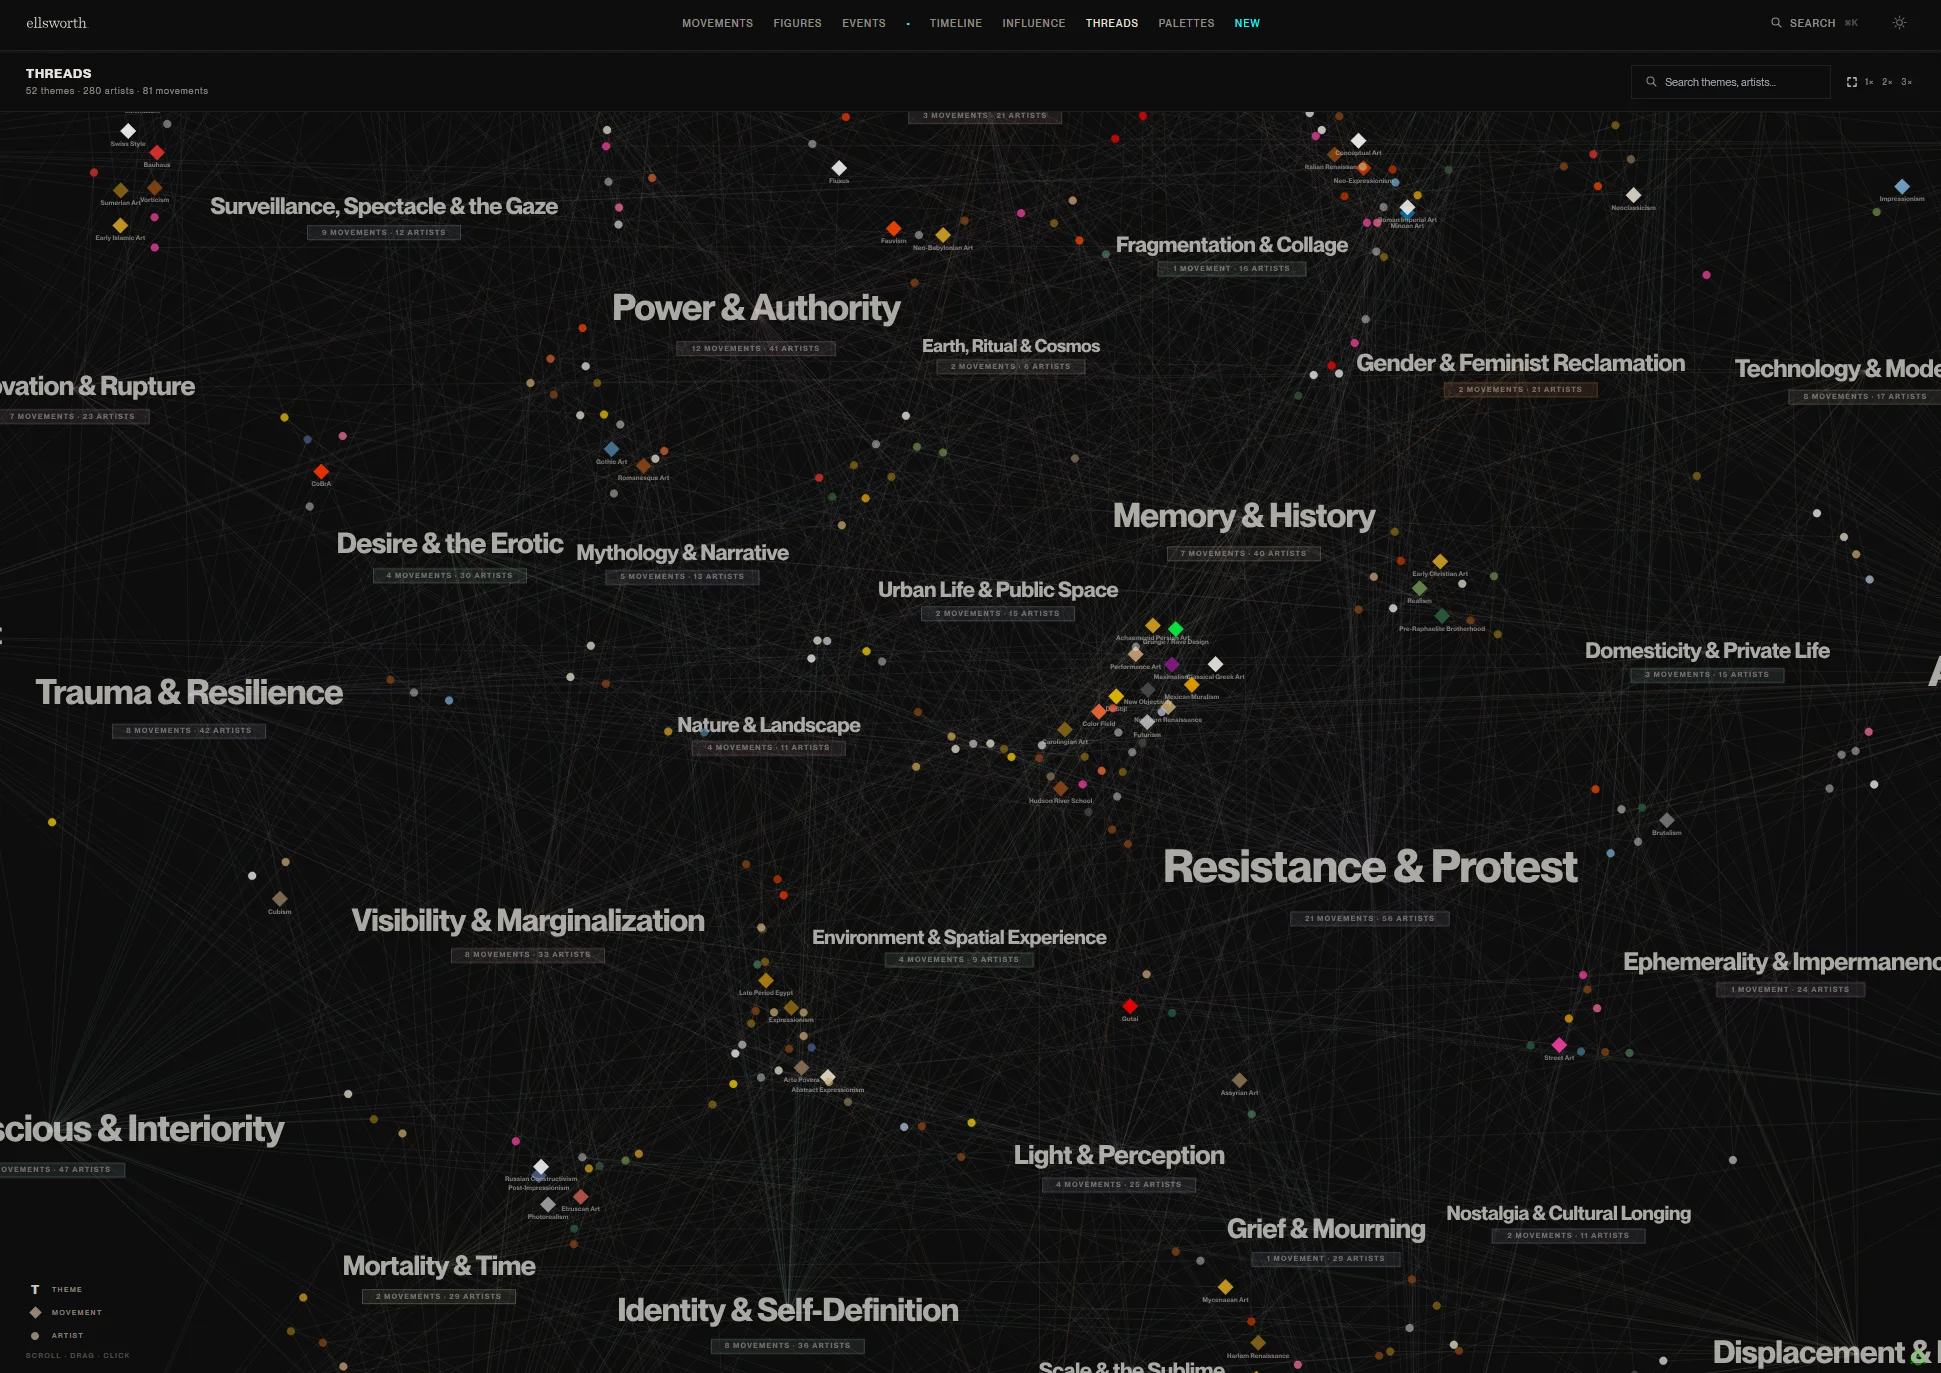
Threads sits underneath the movement structure as a theme layer. Recurring ideas appear as large typographic nodes in a second force-directed graph: mortality, industrialization, the female form, political resistance, the sublime. Artists and movements orbit each node sized by how central the theme is to their work. Search any term and the graph reorganizes around it.

Threads: recurring ideas as typographic nodes in a force-directed graph, artists and movements orbiting them by thematic centrality
ThreadsThematic connections across centuries — artists linked by ideas rather than chronology or movement membership
03

Palettes

4,243 artworks · k-means · LAB color space

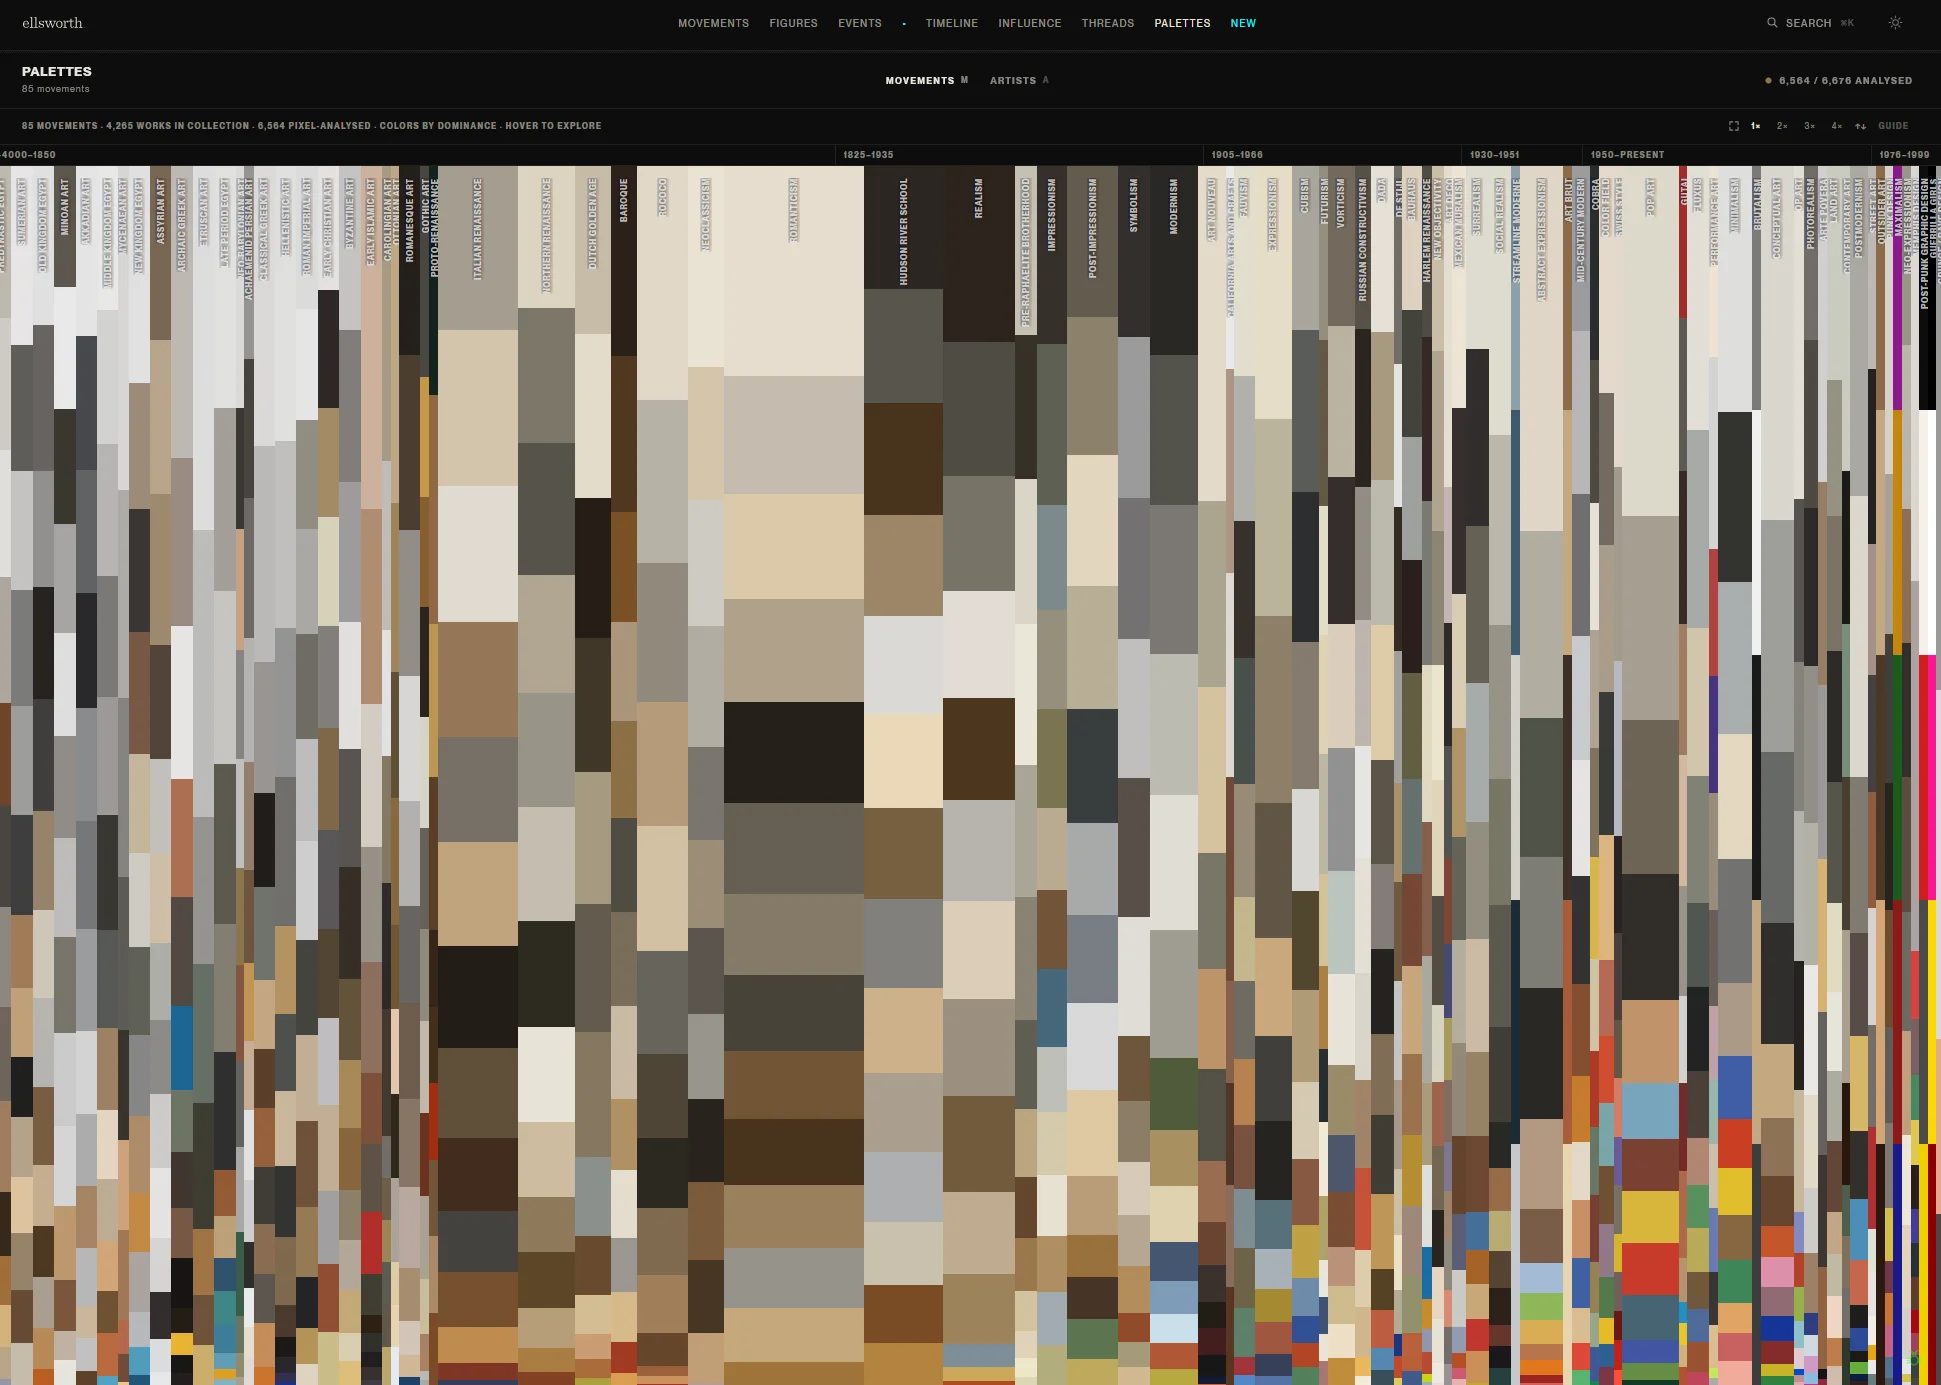
Ellsworth runs k-means color clustering across every artwork image in the database. Each image is reduced to 8 dominant colors in LAB color space — perceptually uniform, so equal distances correspond to equal perceived differences. Those colors aggregate per movement using k-means++ at k=14 to produce a characteristic palette for each era. The result is chronological color strata you can scroll through.

Palettes: chronological color strata, one row per movement, each row a horizontal bar showing k-means color frequency

Tube paint was invented in 1841. You can see Impressionism's lavenders and aquas arrive exactly when they should — a clear discontinuity in the strata that no written argument needed.

04

Artists & Discovery

profiles · live pipeline

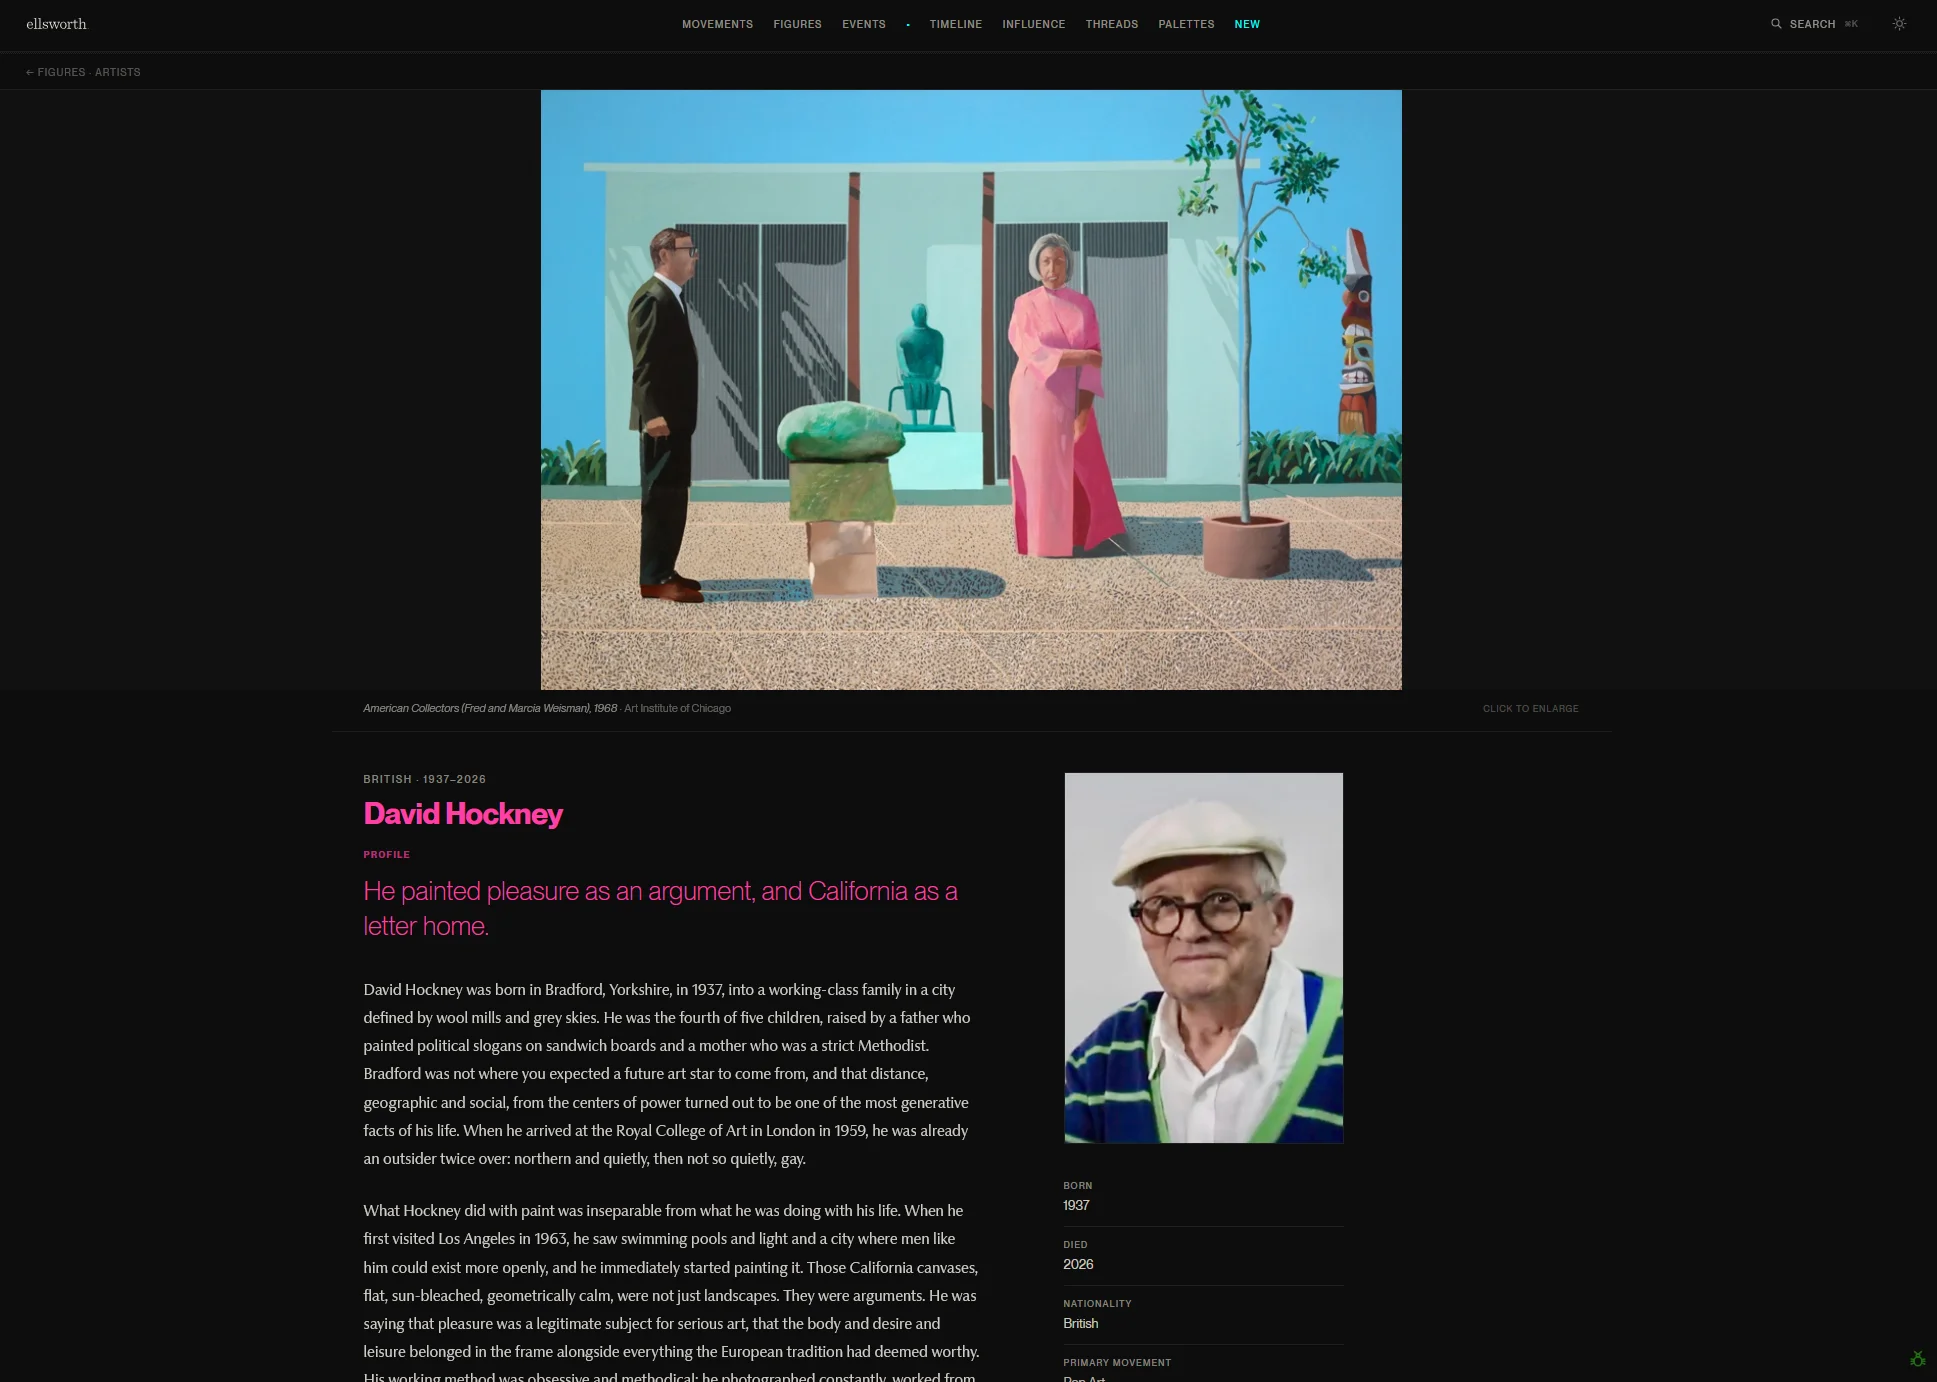
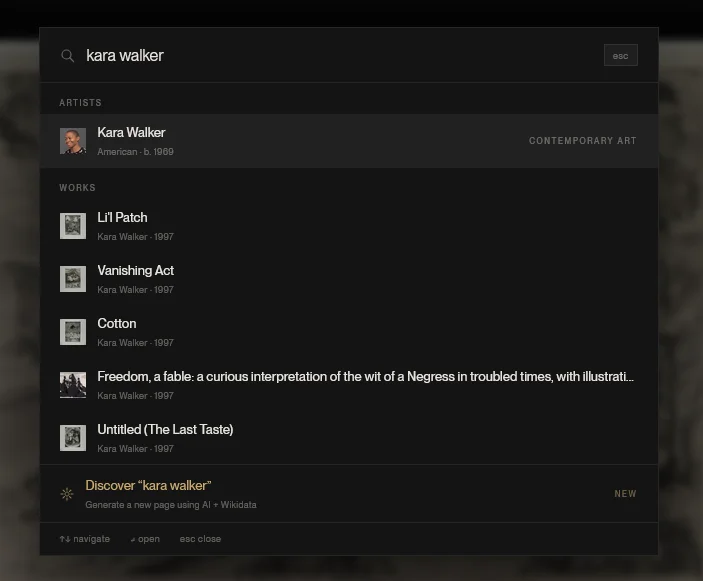
Every artist in the database gets a full profile page: portrait, biography, movement affiliations, and a chronological gallery pulled from the museum APIs. Gallery images arrive at wildly different resolutions and aspect ratios, so a cropping layer anchors to compositional interest rather than just centering. When a search query doesn't match anything in the database, Ellsworth runs a live pipeline instead of returning a dead end: validate, fetch from Wikidata, generate a Claude narrative, commit to the database. A five-step loader shows progress. Popular searches build the database over time.

Artist profile: portrait, biography, movement affiliations, chronological artwork gallery
ArtistFull profiles with portrait, biography, movement affiliations, and a chronological gallery. Cropping anchors to compositional interest rather than center.
Discovery pipeline: search triggers validate, fetch, generate, commit as a five-step loader
DiscoveryUnknown artist or movement triggers a live pipeline: validate, fetch from Wikidata, generate a Claude narrative, commit to the database. A five-step loader shows progress.

Ellsworth is a personal project and the API is open. Artist pages are getting a visual redesign. The timeline needs more work on mobile. Museum API coverage keeps expanding as more institutions open their collections. The long-term goal is a database that grows organically through use.

ellsworth.ai ↗

Tech: Next.js, TypeScript, D3, Claude API, Wikidata, Met Museum API, Art Institute of Chicago API, Redis, Postgres

Role: Design, engineering, editorial

Context: Personal project · ellsworth.ai